Visualize operations through networking
The challenges facing sewing factories
Do you face any of the following challenges?
Shortages of labor and young applicants; the retirement of skilled workers and aging of maintenance personnel; difficulties in handing down expertise, training successors, and training employees; the need to boost operator motivation; the demand for the small-lot production of highly diverse products; the need to facilitate setup procedures, upgrade plant management, go paperless, stabilize quality, and simplify maintenance operations...
JUKI network system ~ JaNets JT Simple ~
What is JaNets JT Simple?
Visualize the real-time status of your production site and connect it to the future with IoT!
JaNets is an IoT service provided by JUKI to improve production capacity.
Features of JaNets
JaNets is equipped with a host of features that help manufacturers grasp the current conditions of their factories.
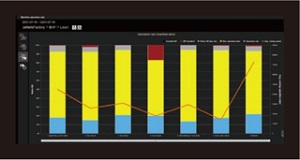
Visualized operation rates!
Set the feed dog height and feed locus on the panel to streamline adjustment!
A remaining thread length of 3mm is achieved at the end of sewing.
Visualized processing times!
Check how much time your operators spend to sew one piece of a product.
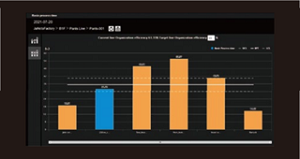
Visualized progress!
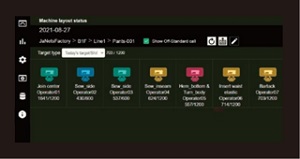
Check the progress of production without wasting man-hours.
Visualized output quantities!
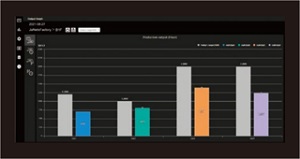
Check the actual output quantity against your target for each piece of equipment.
導入事例
Reduced working hours spent to compile data
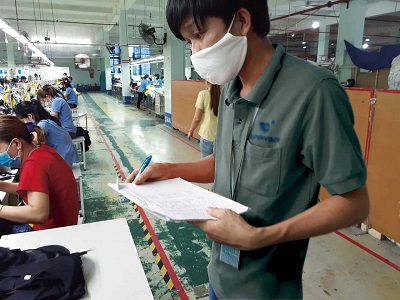
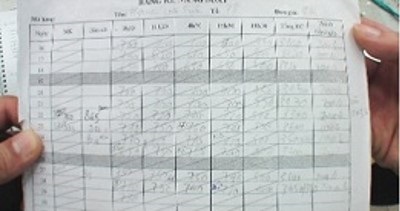
Problems
Many employees and man-hours were required to survey the production status of a line and compile the data. The production volumes had to be checked by actually visiting each process. The data, moreover, were aggregated manually. (Data aggregation with pen and paper required three to four hours every time.)
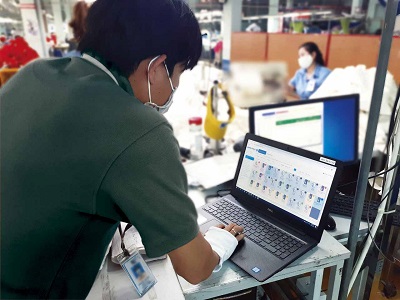
After the improvement
The JaNets system automatically collects and compiles data. Its function to output the production volume in Excel has significantly reduced the man-hours required for compiling. Data are collectively confirmed on the report screen. Human work to compile the data is a thing of the past! (Output in Excel format: 5 to 10 minutes)

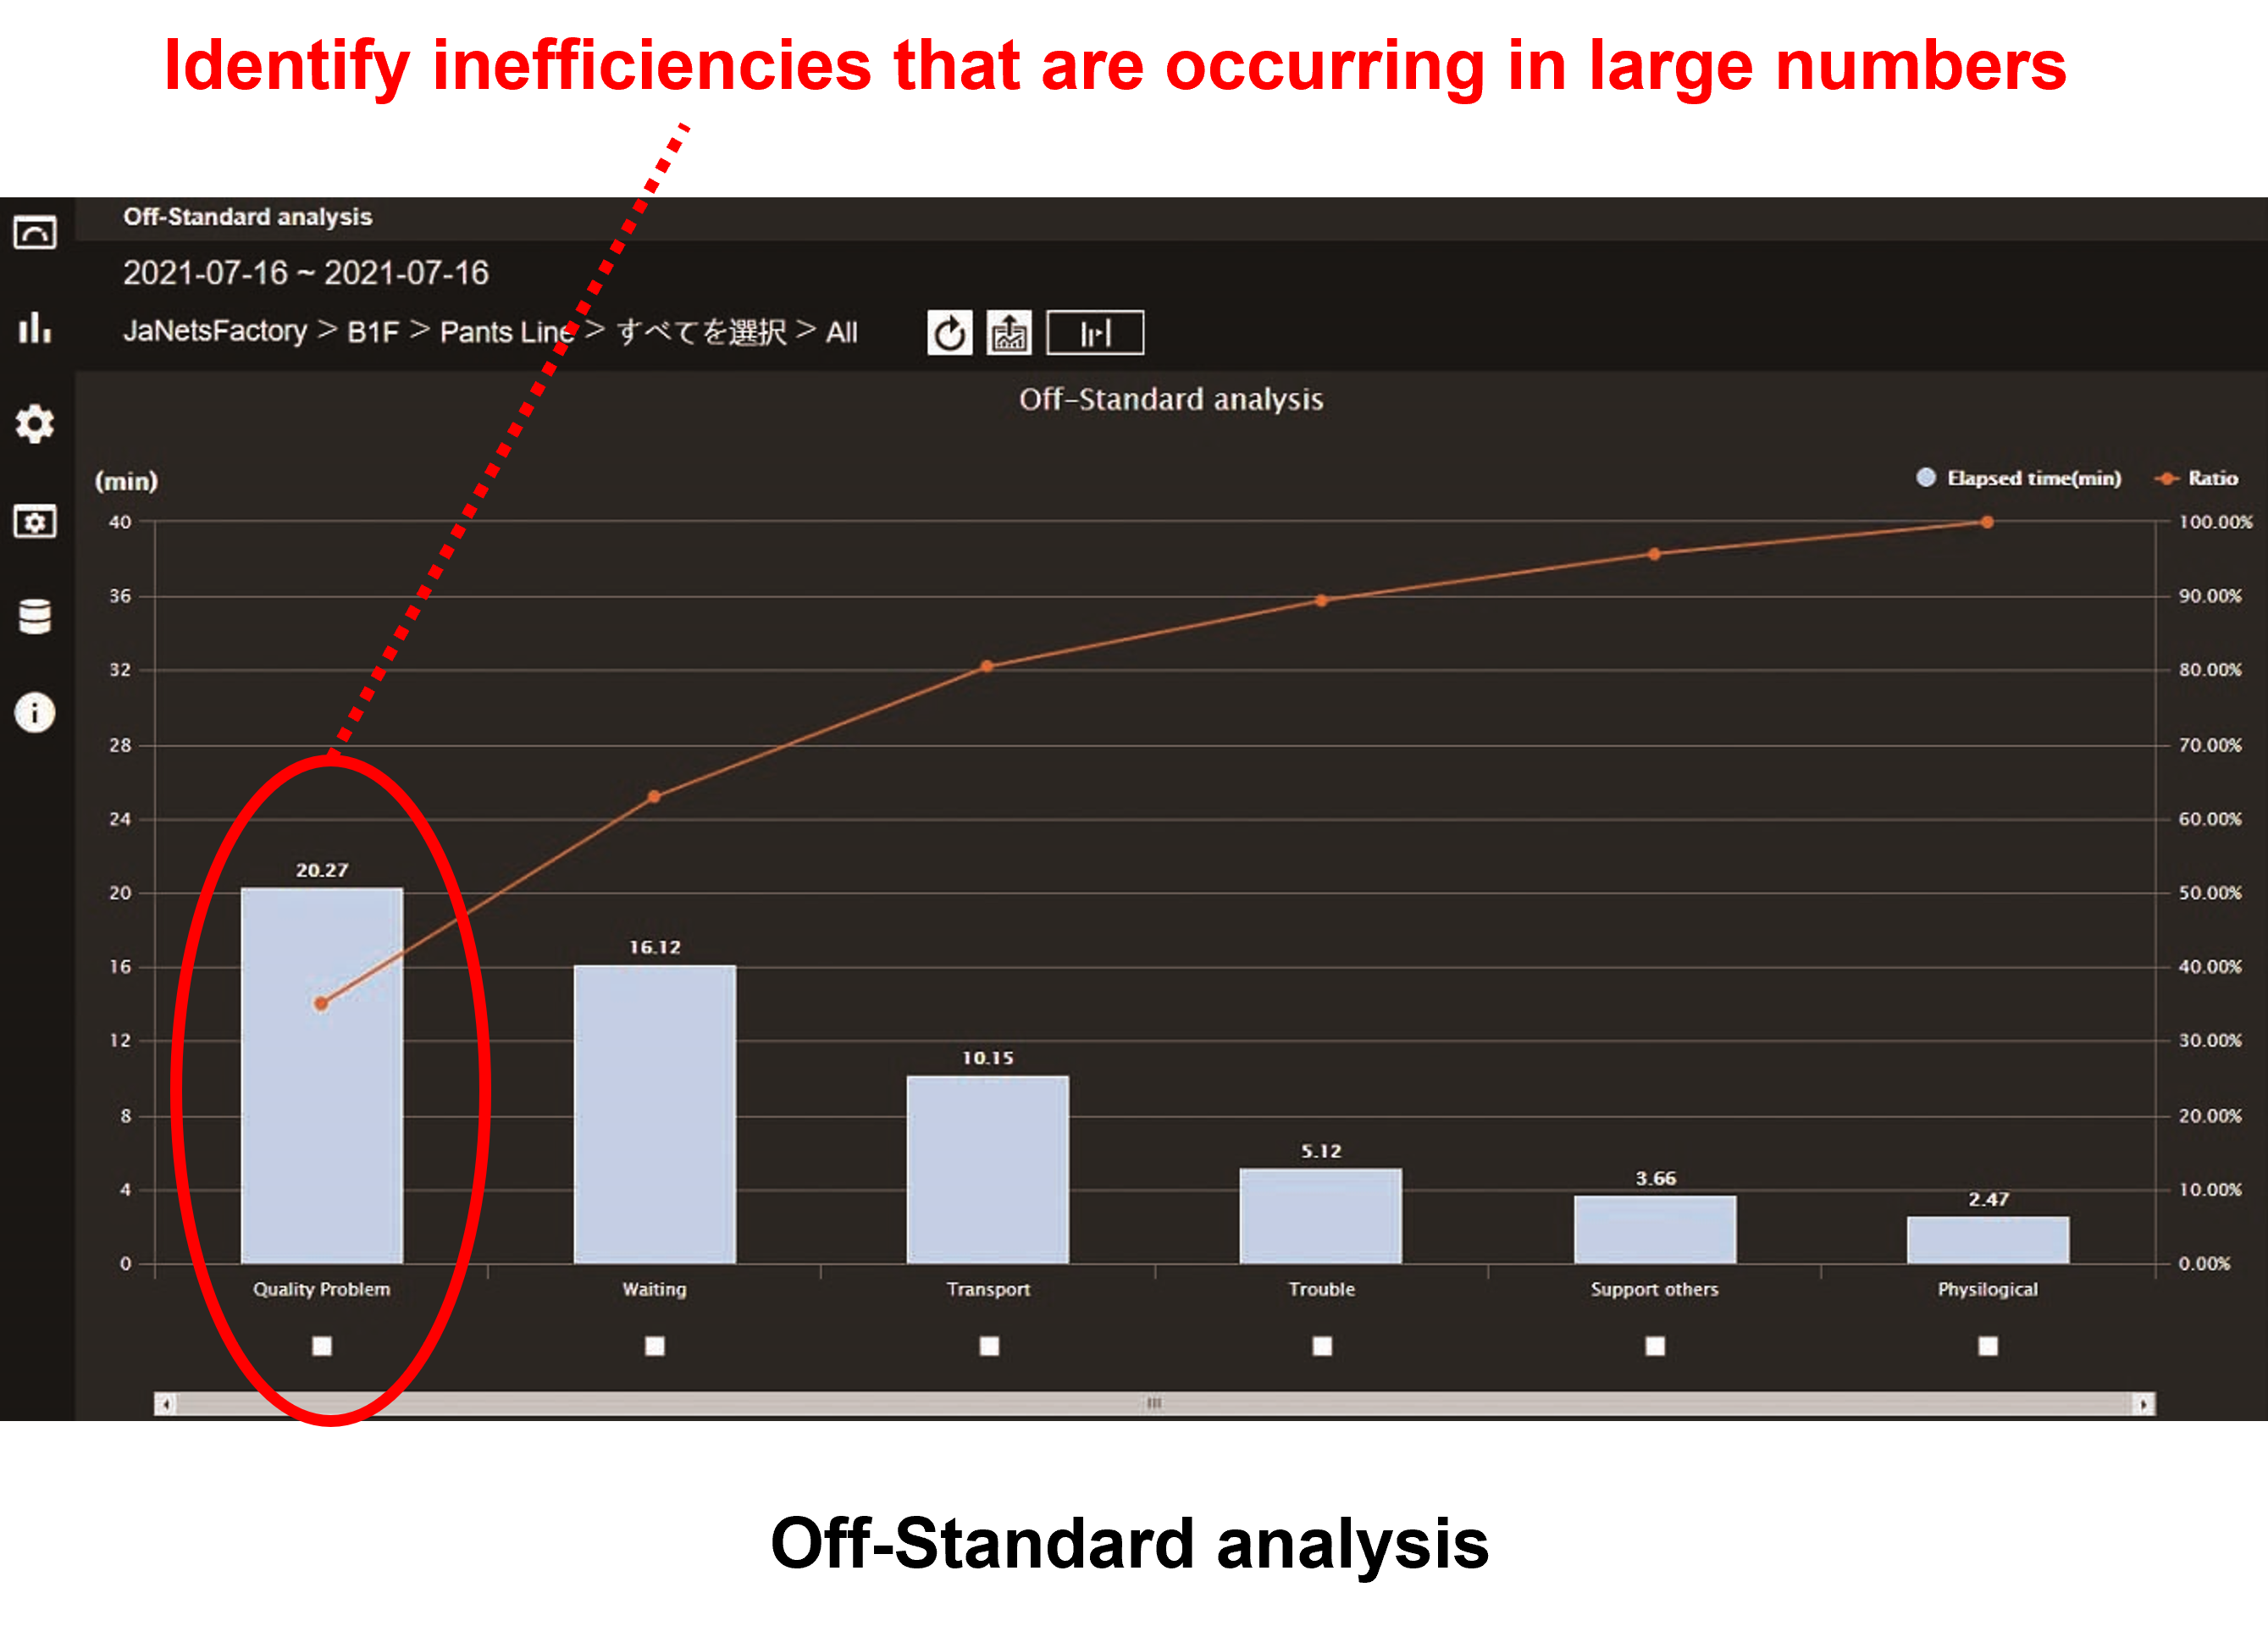
JaNets identifies wasteful processes in a line to plan out improvements.
Problems
There’s no way of knowing which processes are wasteful in a line. As a result, no improvements can be expected.
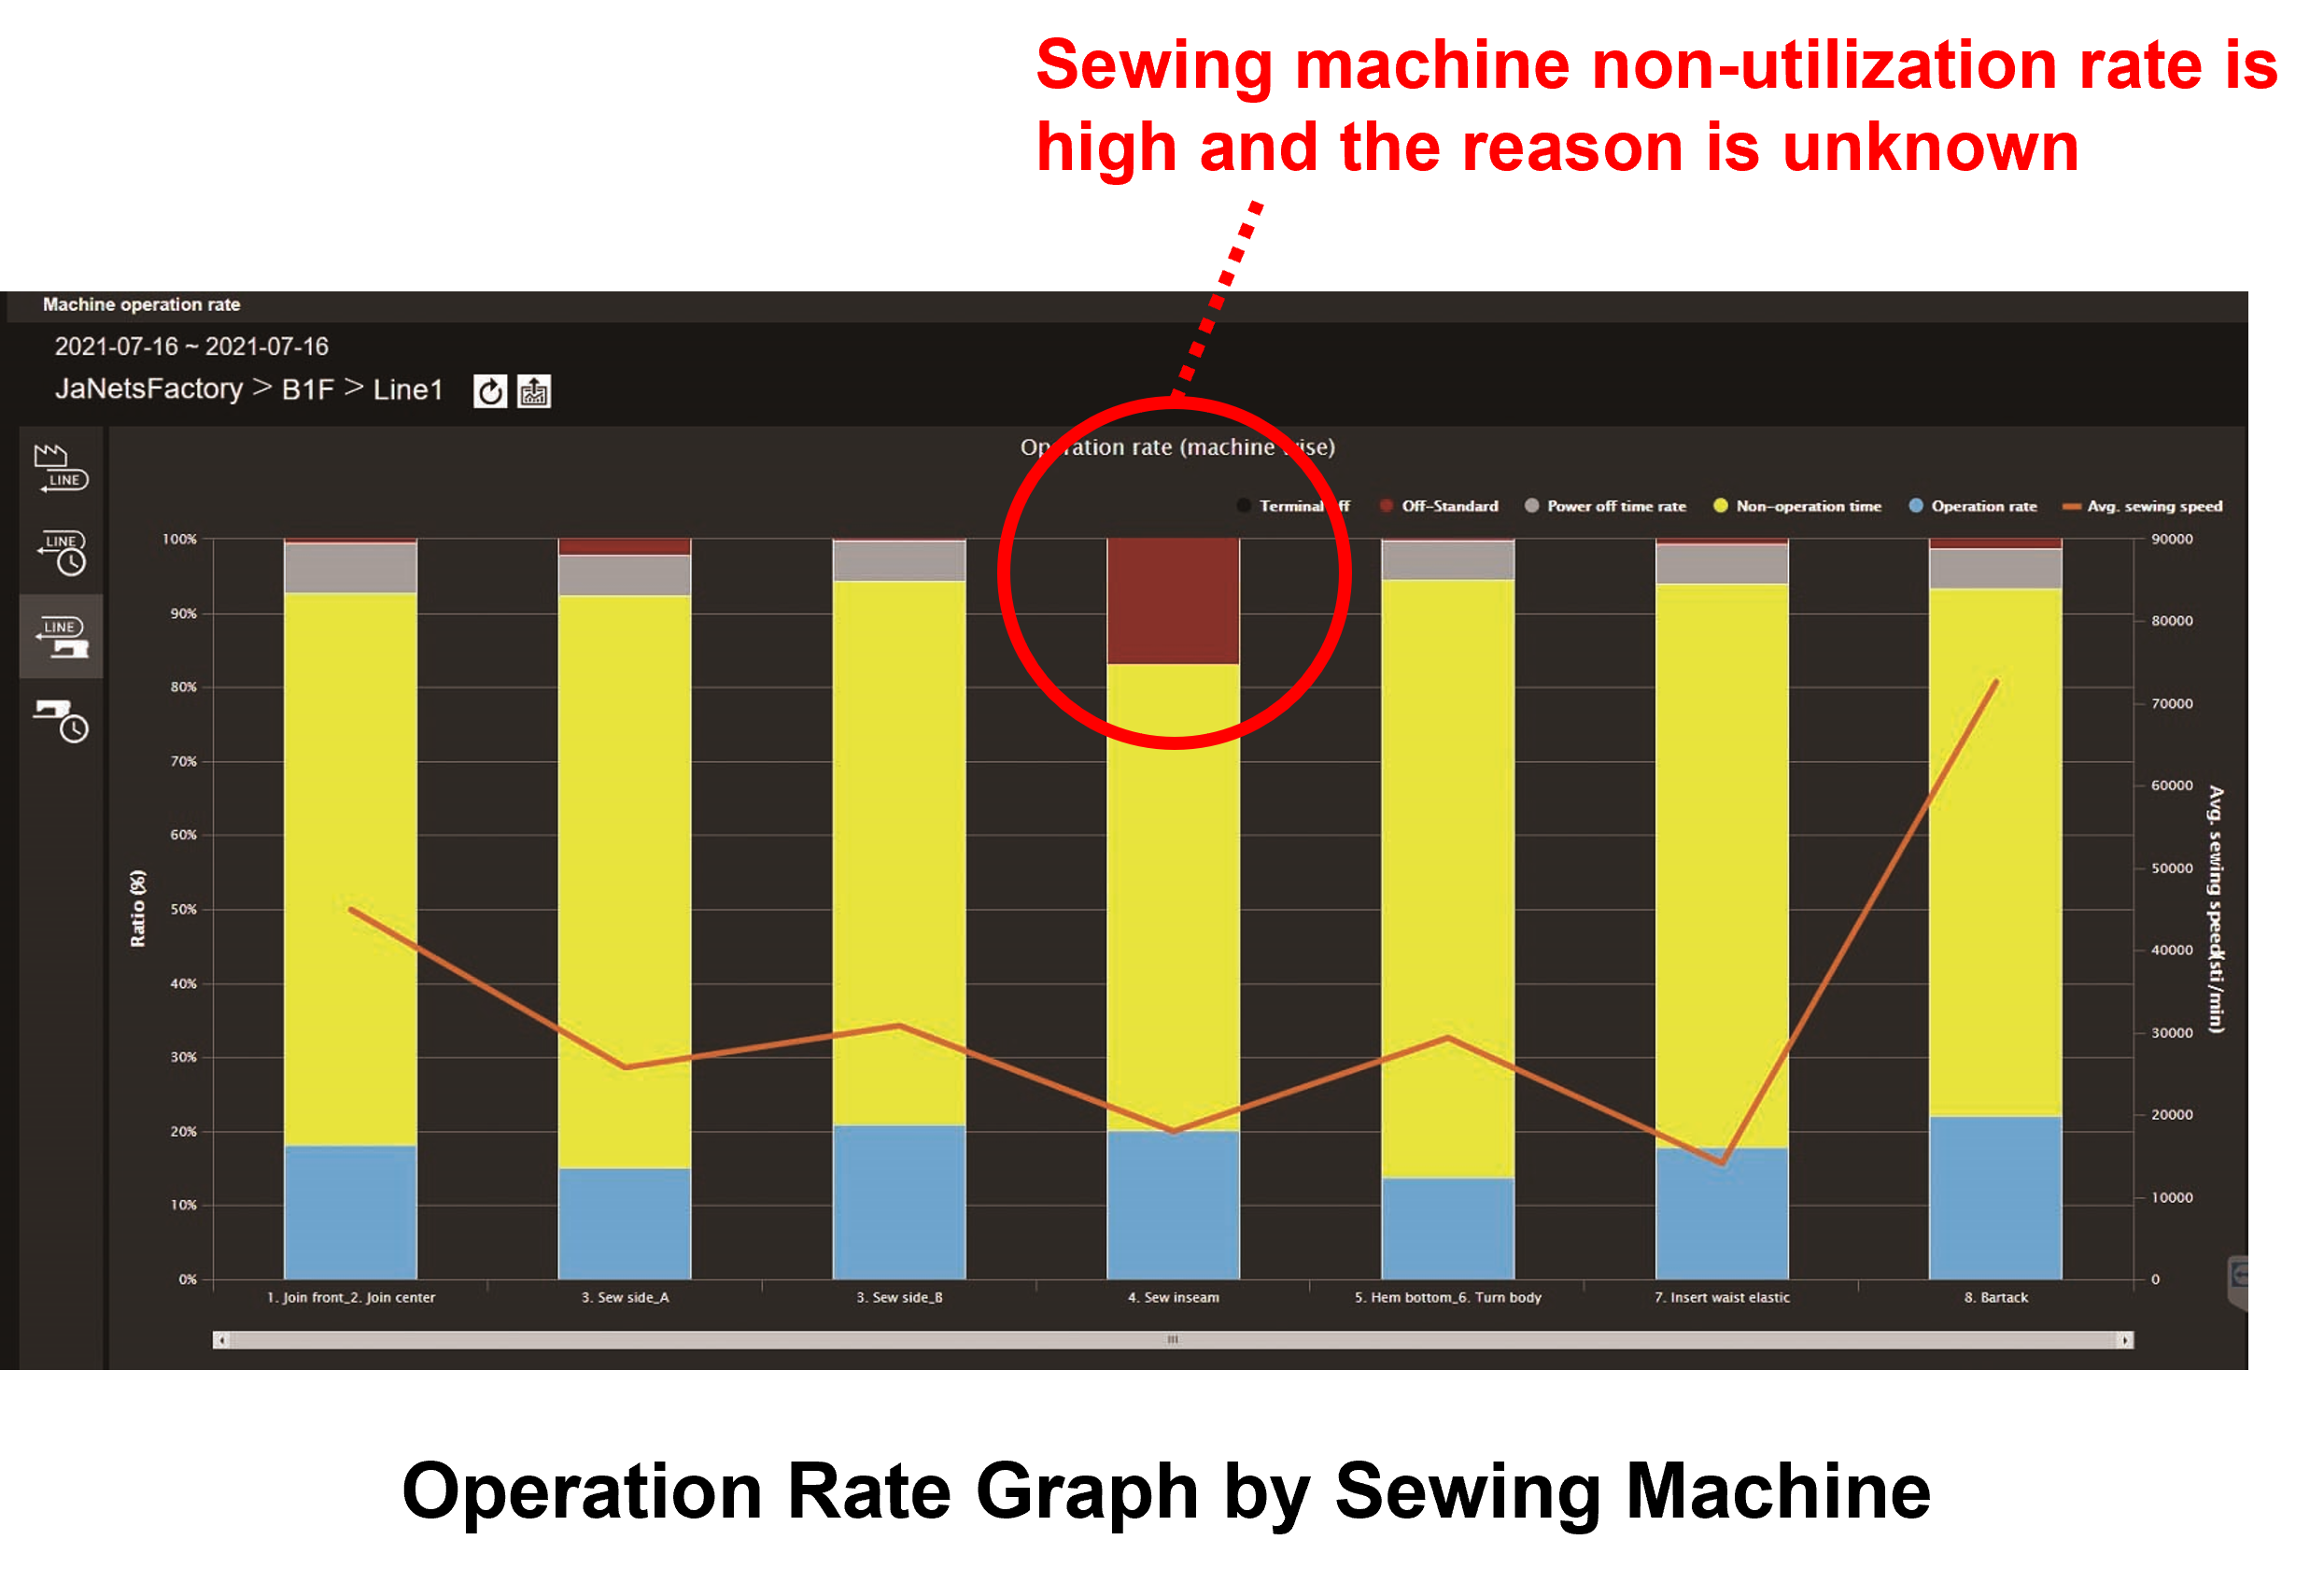
After the improvement
The chart visualizing the operation rates shows the equipment that generates the waste. The chart visualizing irregular work incidents gives you a detailed grasp of the waste taking place (number of wasteful processes and generation rate).
Other Smart Factory solutions
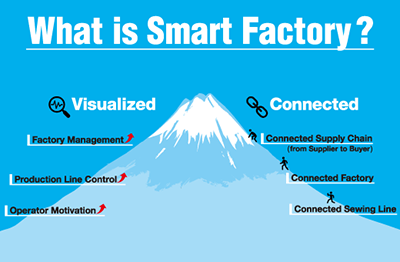
What is Smart Factory?
![]()
![]()